In this unit, we’ll cover the basics of what you need to know about Elasticsearch in order to use it.
Elasticsearch is a real-time distributed and open source full-text search and analytics engine. It is developed in Java.
HOW ELASTICSEARCH REPRESENTS DATA

Key Concepts:
Node- It refers to a single running instance of Elasticsearch. A node is created when a elasticsearch instance is started.
Document- A Document is the unit of search and index.
Index- An index consists of one or more Documents, and a Document consists of one or more Fields. In database terminology, a Document corresponds to a table row, and a Field corresponds to a table column.
Type- A type in Elasticsearch represents a class of similar documents and it has a name such as “customer” or “item.”.
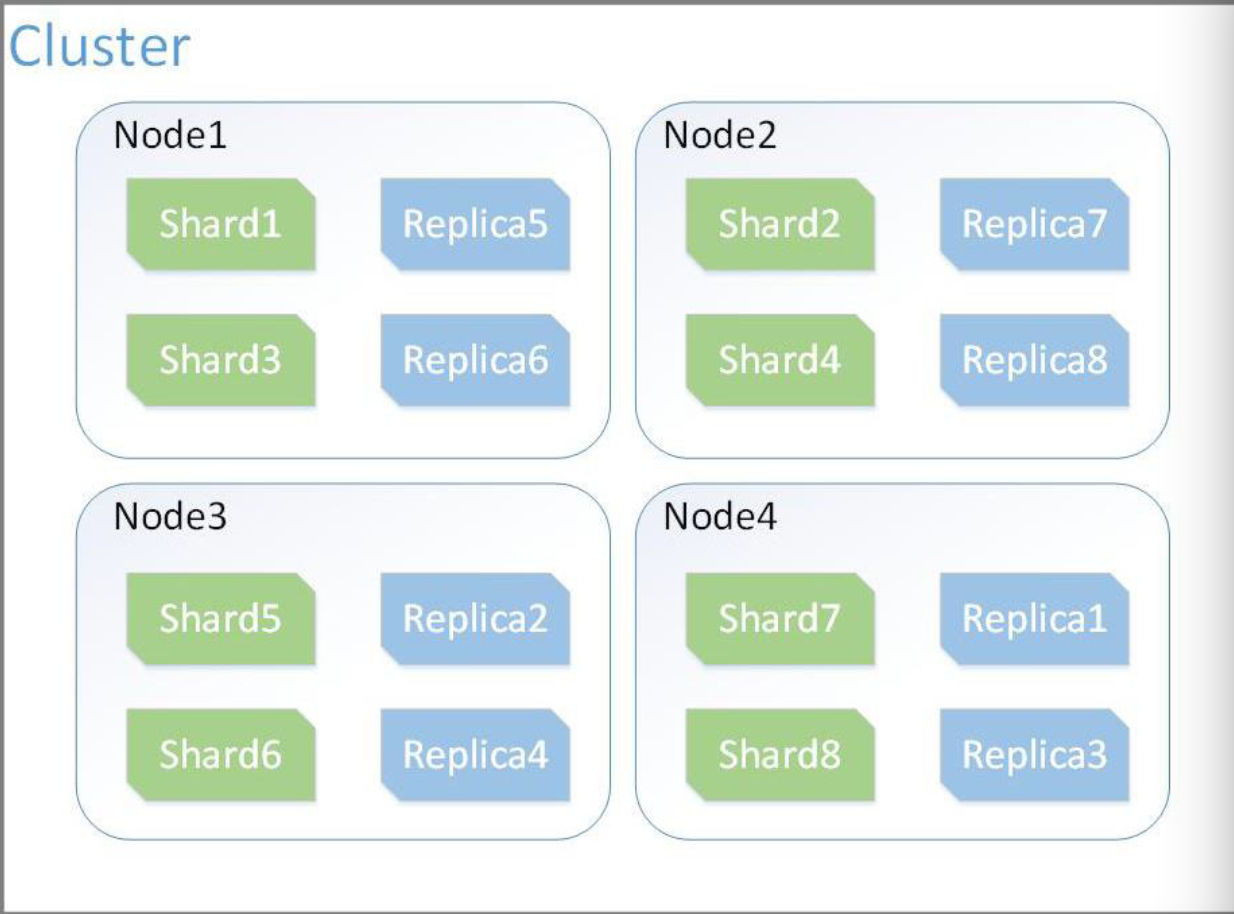
Cluster- Cluster provides collective indexing and search capabilities across all the nodes for entire data. It is a collection of one or more nodes (servers) that together holds your entire data and provides federated indexing and search capabilities across all nodes.
Shard- Indexes are horizontally subdivided into shards. This means each shard contains all the properties of document but contains less number of JSON objects than index. The shard is the atomic part of an index, which can be distributed over the cluster if you add more nodes.
Replicas- Elasticsearch allows a user to create replicas of their indexes and shards. Replication not only helps in increasing the availability of data in case of failure, but also improves the performance of searching by carrying out a parallel search operation in these replicas.
Advantages
- Elasticsearch is developed on Java, which makes it compatible on almost every platform.
- Elasticsearch is real time, in other words after one second the added document is searchable in this engine
- Elasticsearch is distributed, which makes it easy to scale and integrate in any big organization.
- Creating full backups are easy by using the concept of gateway, which is present in Elasticsearch.
Kibana
Kibana is the visualization layer of the ELK Stack—the world’s most popular log analysis platform which is comprised of Elasticsearch, Logstash, and Kibana.
So what is it about Kibana that makes it a must-have tool for Elasticsearch?
-
Kibana is designed to help you understand your data better by providing a single interface that makes interaction with the Elastic Stack easy and time-saving.
-
Kibana is 100% open-source — its source code is available on GitHub repository and everyone can contribute to its development.
Setup and Installation on Docker
Images are available for running Kibana as a Docker container. They may be downloaded from the Elastic Docker Registry.
Pulling the image
Run docker pull command against the Elastic Docker registry.
docker pull docker.elastic.co/kibana/kibana:7.7.0
The following command can be used to connect to a local elasticsearch container:
docker run --link YOUR_ELASTICSEARCH_CONTAINER_NAME_OR_ID:elasticsearch -p 5601:5601 {docker-repo}:{version}
The conventional approach for configuring Kibana on docker is to provide kibana.yml file.
version: "2"
services:
  kibana:
    image: docker.elastic.co/kibana/kibana:7.7.0
    volumes:
      - ./kibana.yml:/usr/share/kibana/config/kibana.yml
Kibana can also be configured via environment variables by providing SERVER_NAME, KIBANA_DEFAULTAPPID, MONITORING_ENABLED. These variables can be set with docker-compose like this:
version: "2"
services:
  kibana:
    image: docker.elastic.co/kibana/kibana:7.7.0
    volumes:
      - ./kibana.yml:/usr/share/kibana/config/kibana.yml
Accessing Kibana
Kibana can be accessed through port 5601. All you need to do is point your web browser at the machine where Kibana is running and specify the port number. For example, localhost:5601 or http://YOURDOMAIN.com:5601.
You can reach the Kibana server’s status page by navigating to the status endpoint, for example, localhost:5601/status. For JSON-formatted server status details, use the API endpoint at localhost:5601/api/status.
